AI-Powered Fleet Management
Astro Motors
A per-vehicle cost ledger and real-time telemetry pipeline built to answer the question a 300-vehicle fleet couldn't: what does any individual vehicle actually cost to run.

Challenge
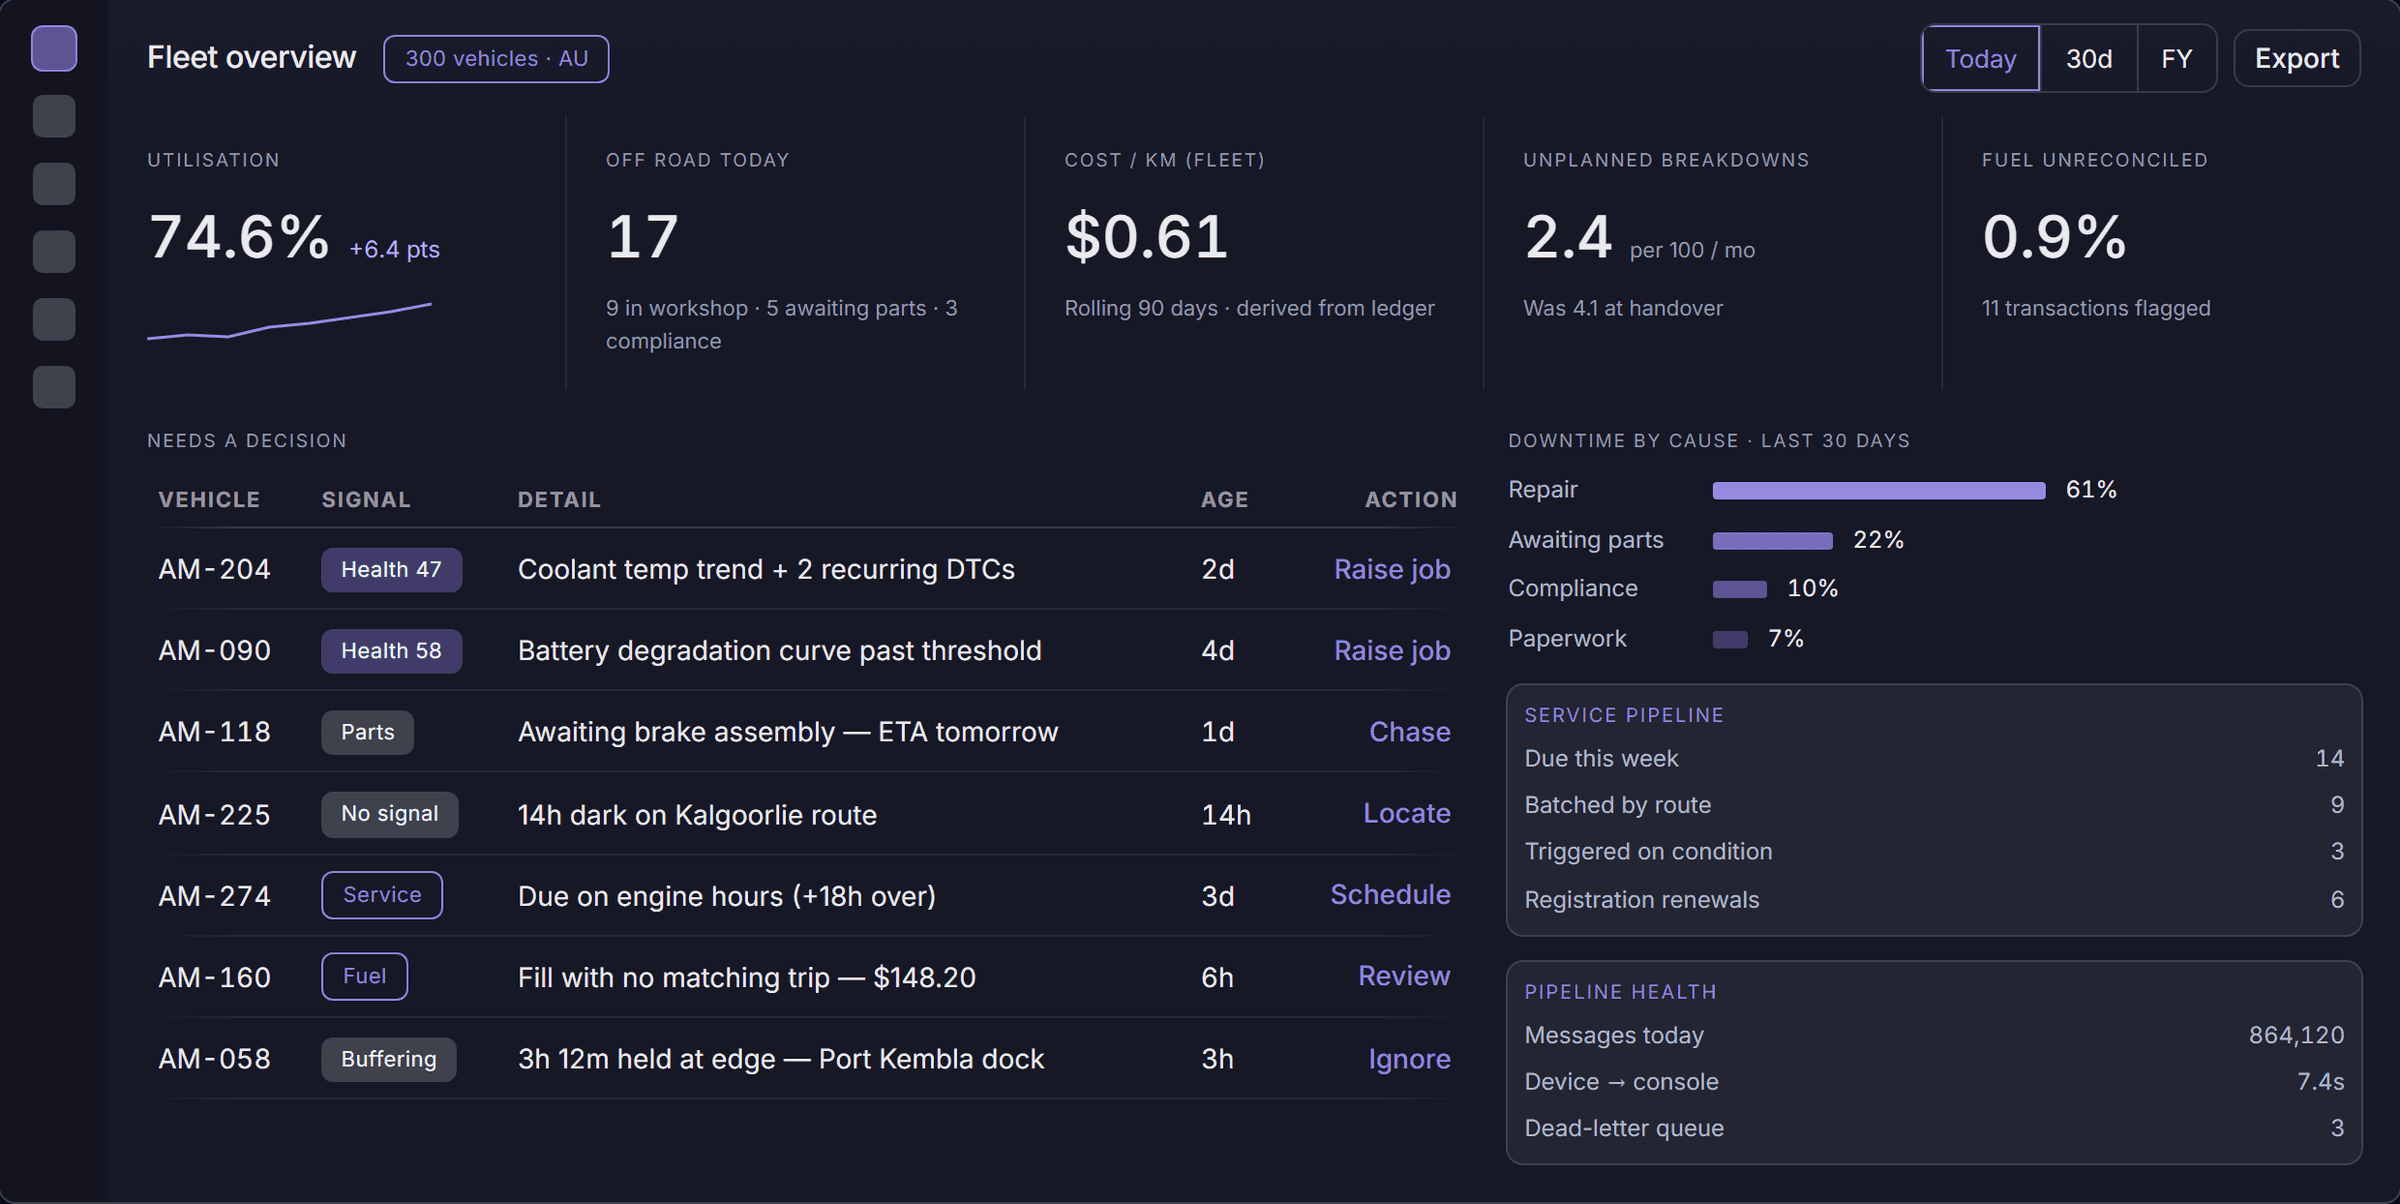
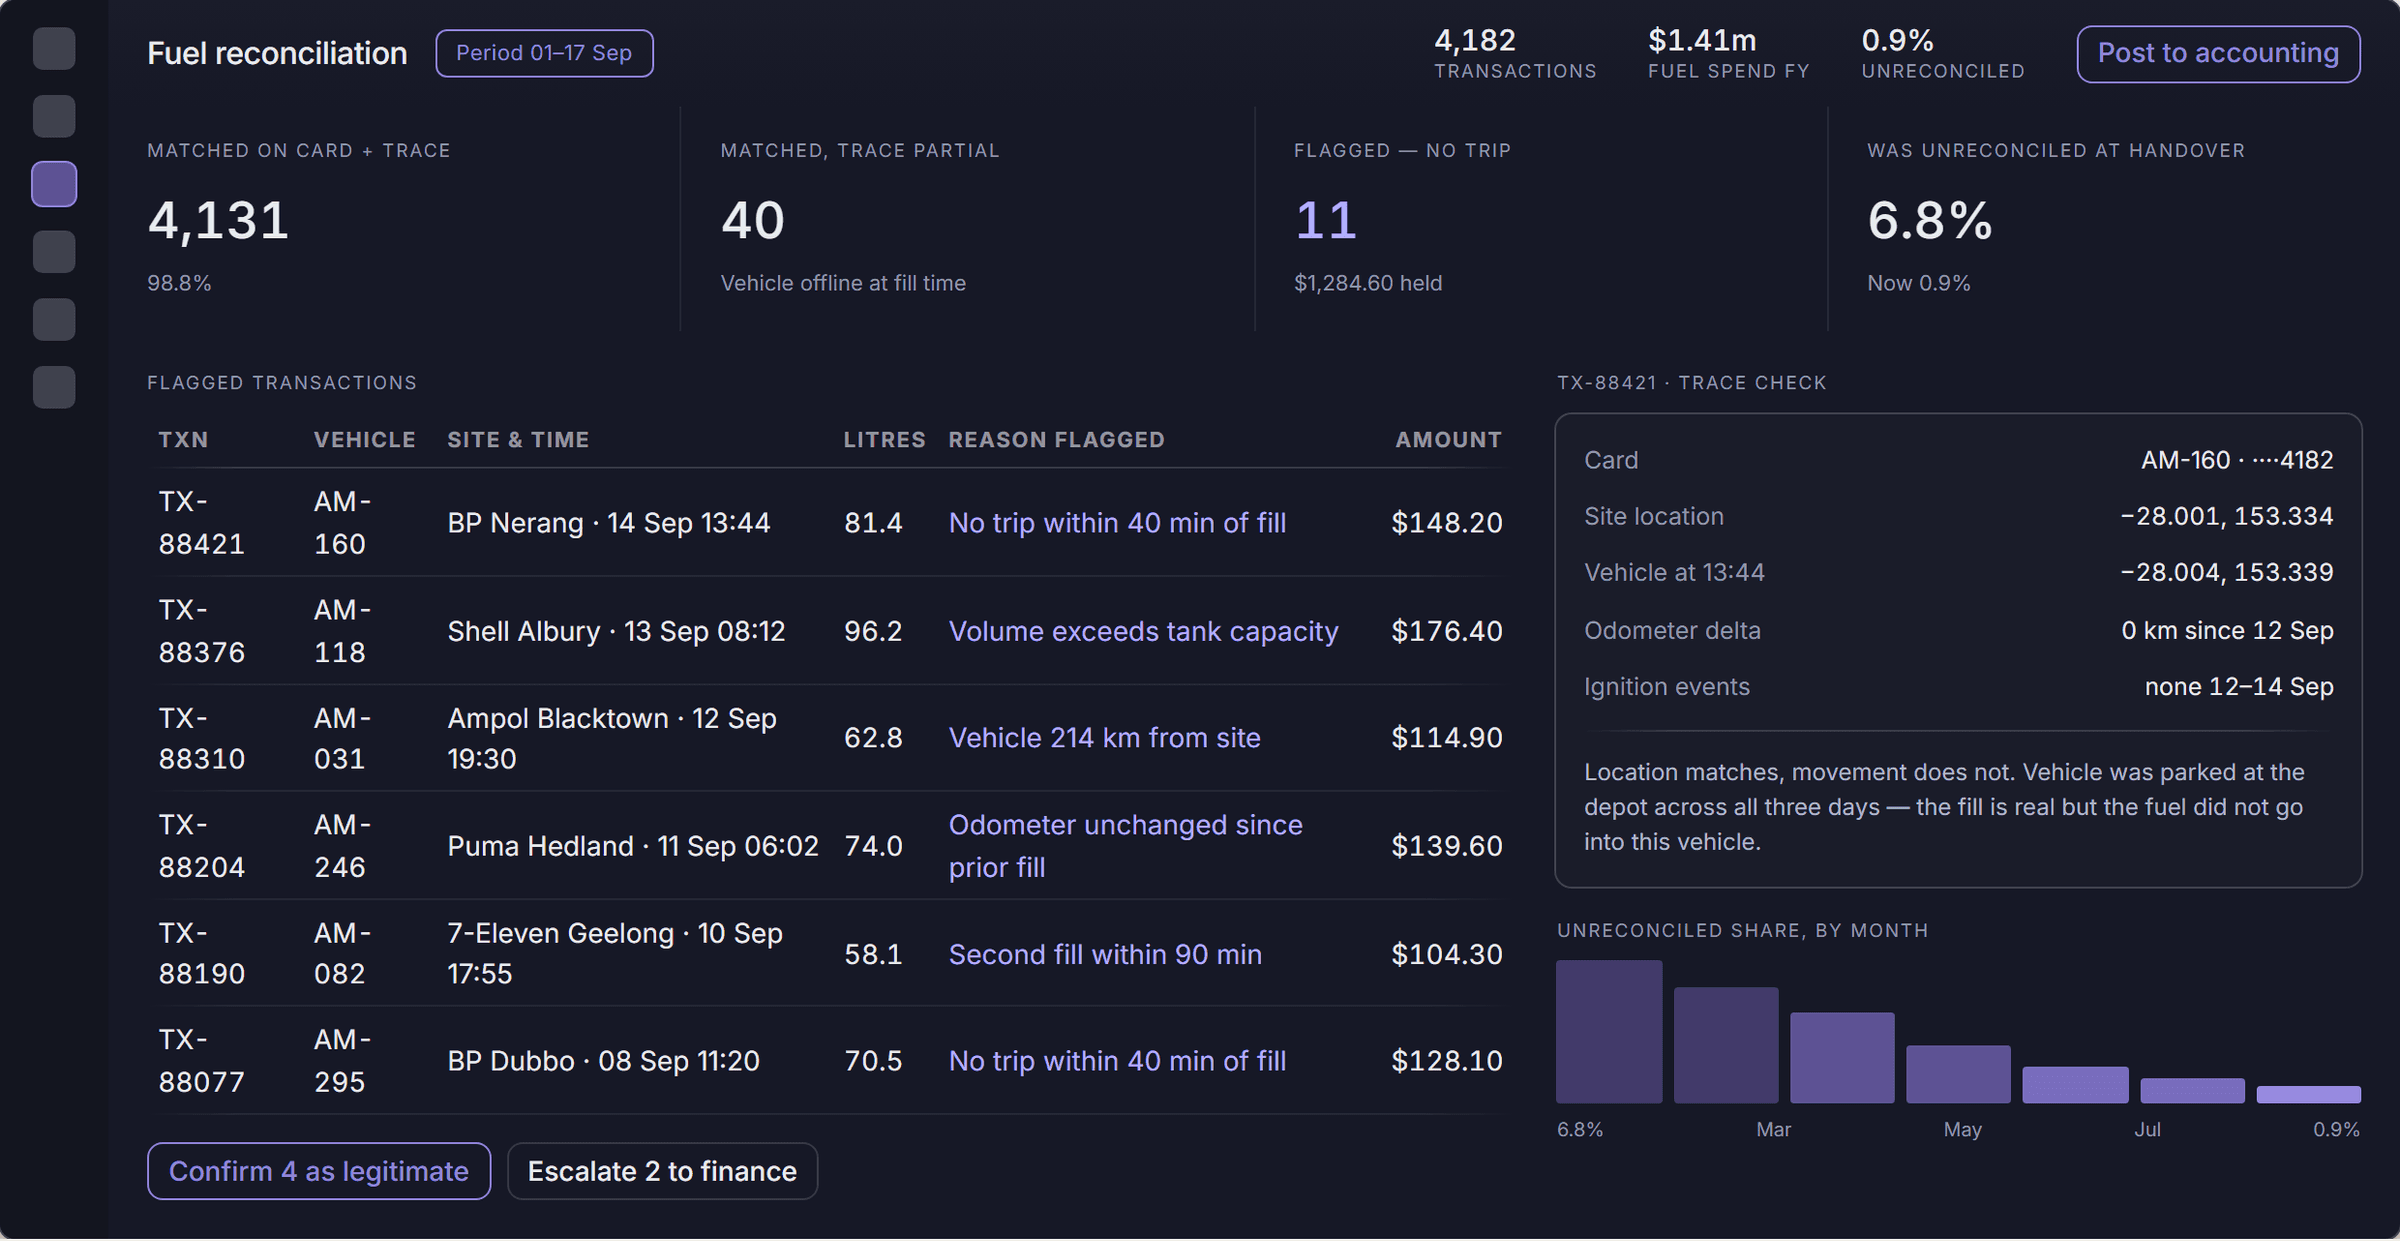
Astro Motors runs a 300-vehicle fleet across Australia. It knew what it had paid for each vehicle and what it eventually sold it for — but the six or seven years in between were a blind spot. Vehicles were tracked in a spreadsheet, maintenance costs in another, and workshop jobs on paper cards that reached the office after the work was already done. Servicing ran on a calendar rather than actual usage, so low-mileage vehicles were serviced needlessly while hard-worked ones failed between intervals — 4.1 unplanned breakdowns per 100 vehicles every month. Each vehicle spent an average of 22.4 days a year off the road, with no visibility into how much of that was repair time versus waiting for a part versus waiting for paperwork. Fuel cards were issued per vehicle, but 6.8% of fuel spend could never be matched to an actual trip, and 11 registration/inspection renewals lapsed in a year. Fleet admin consumed 2.5 full-time staff.
Approach
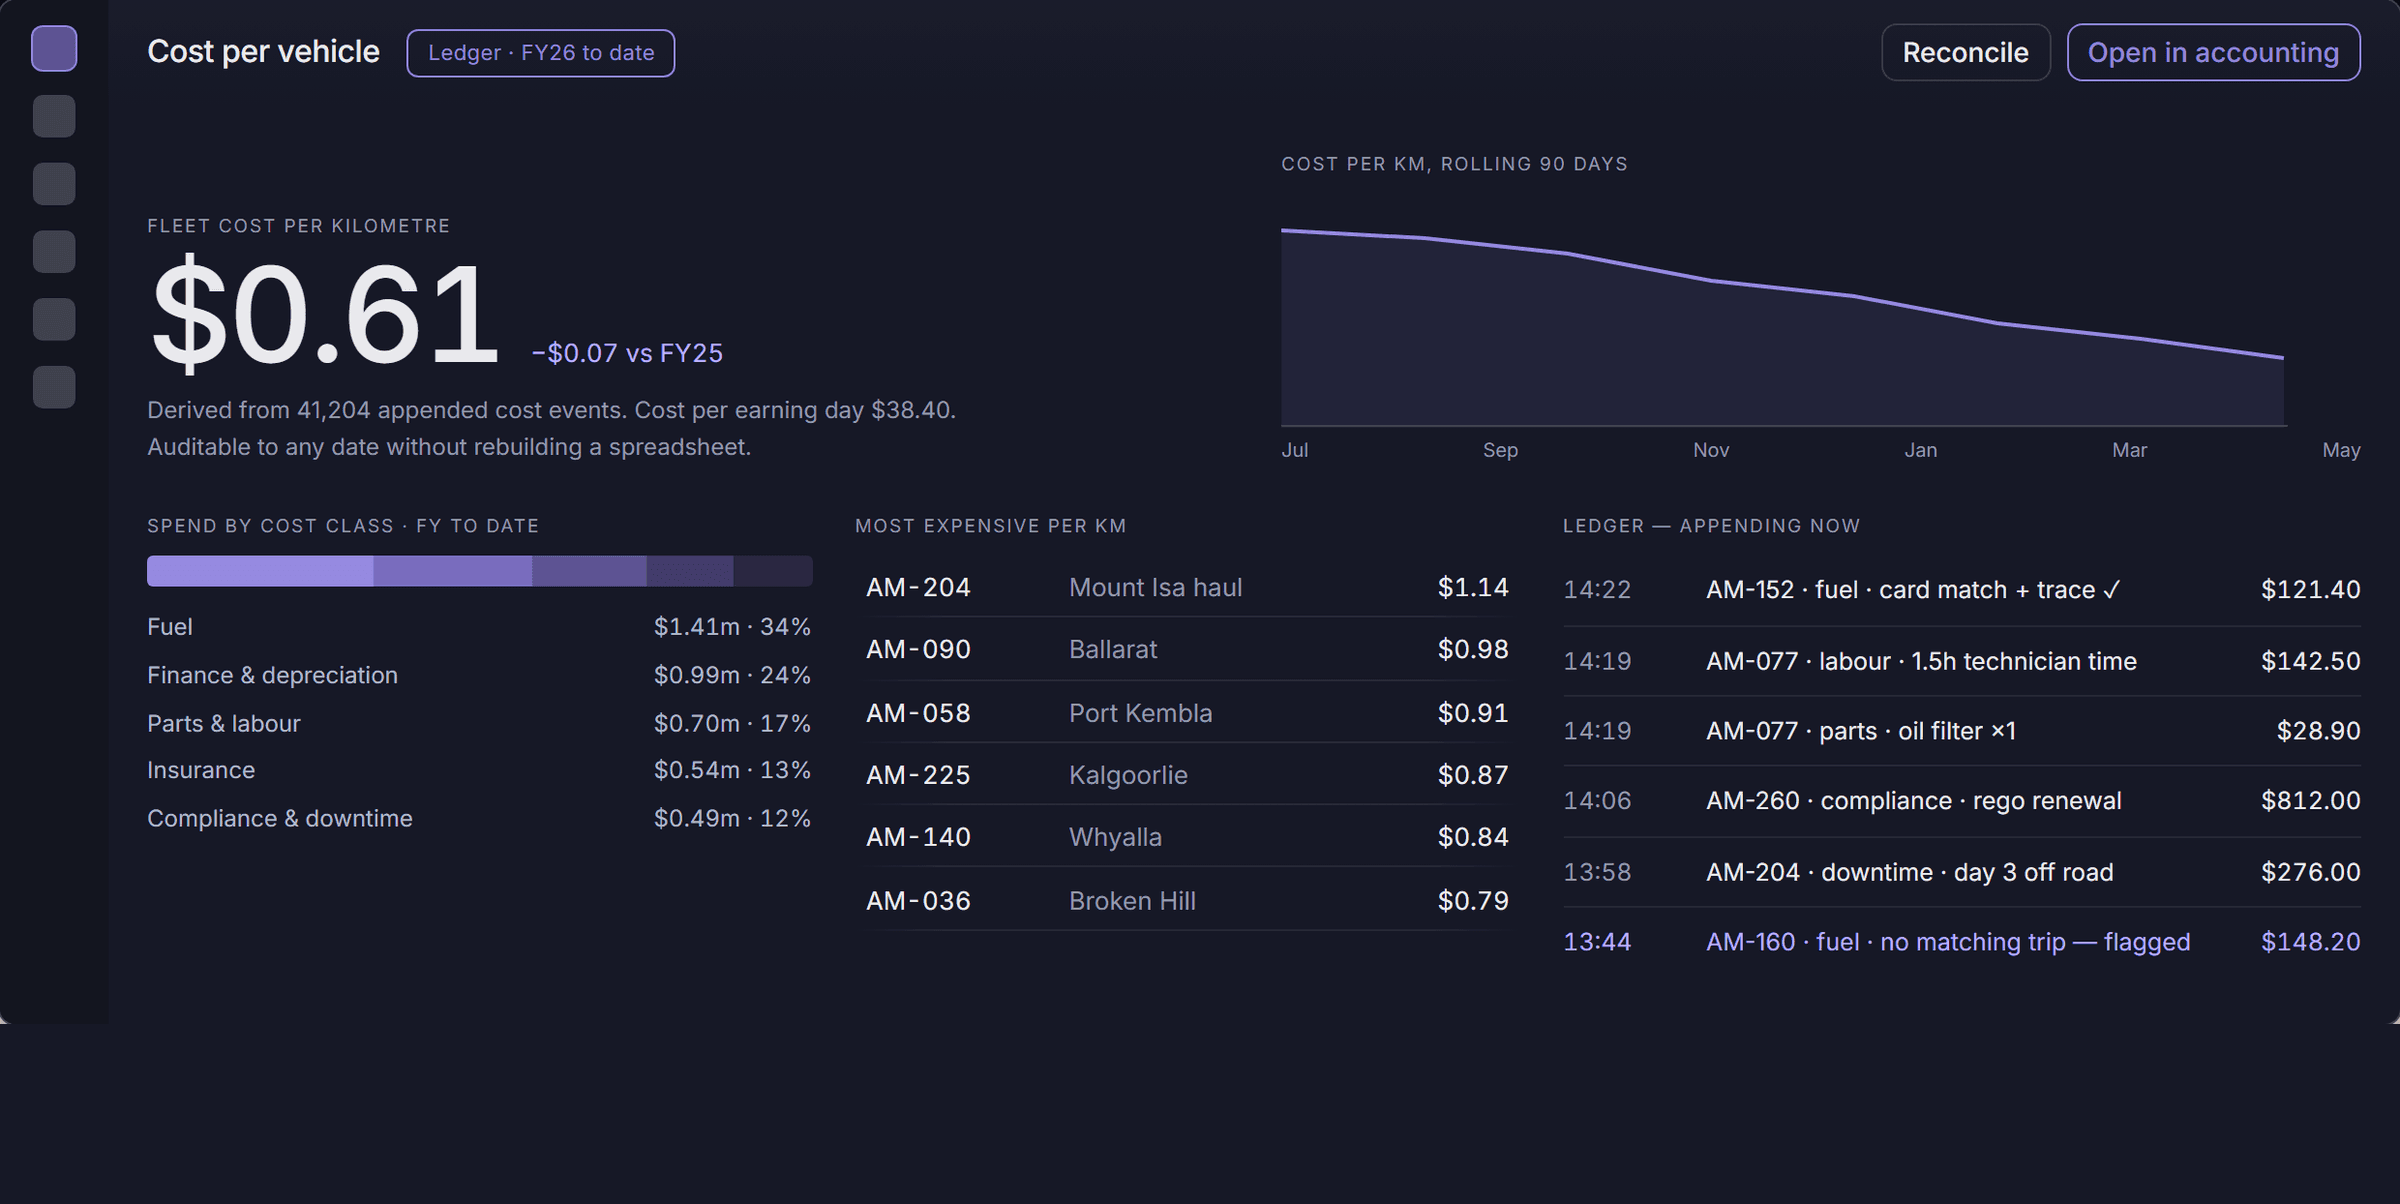
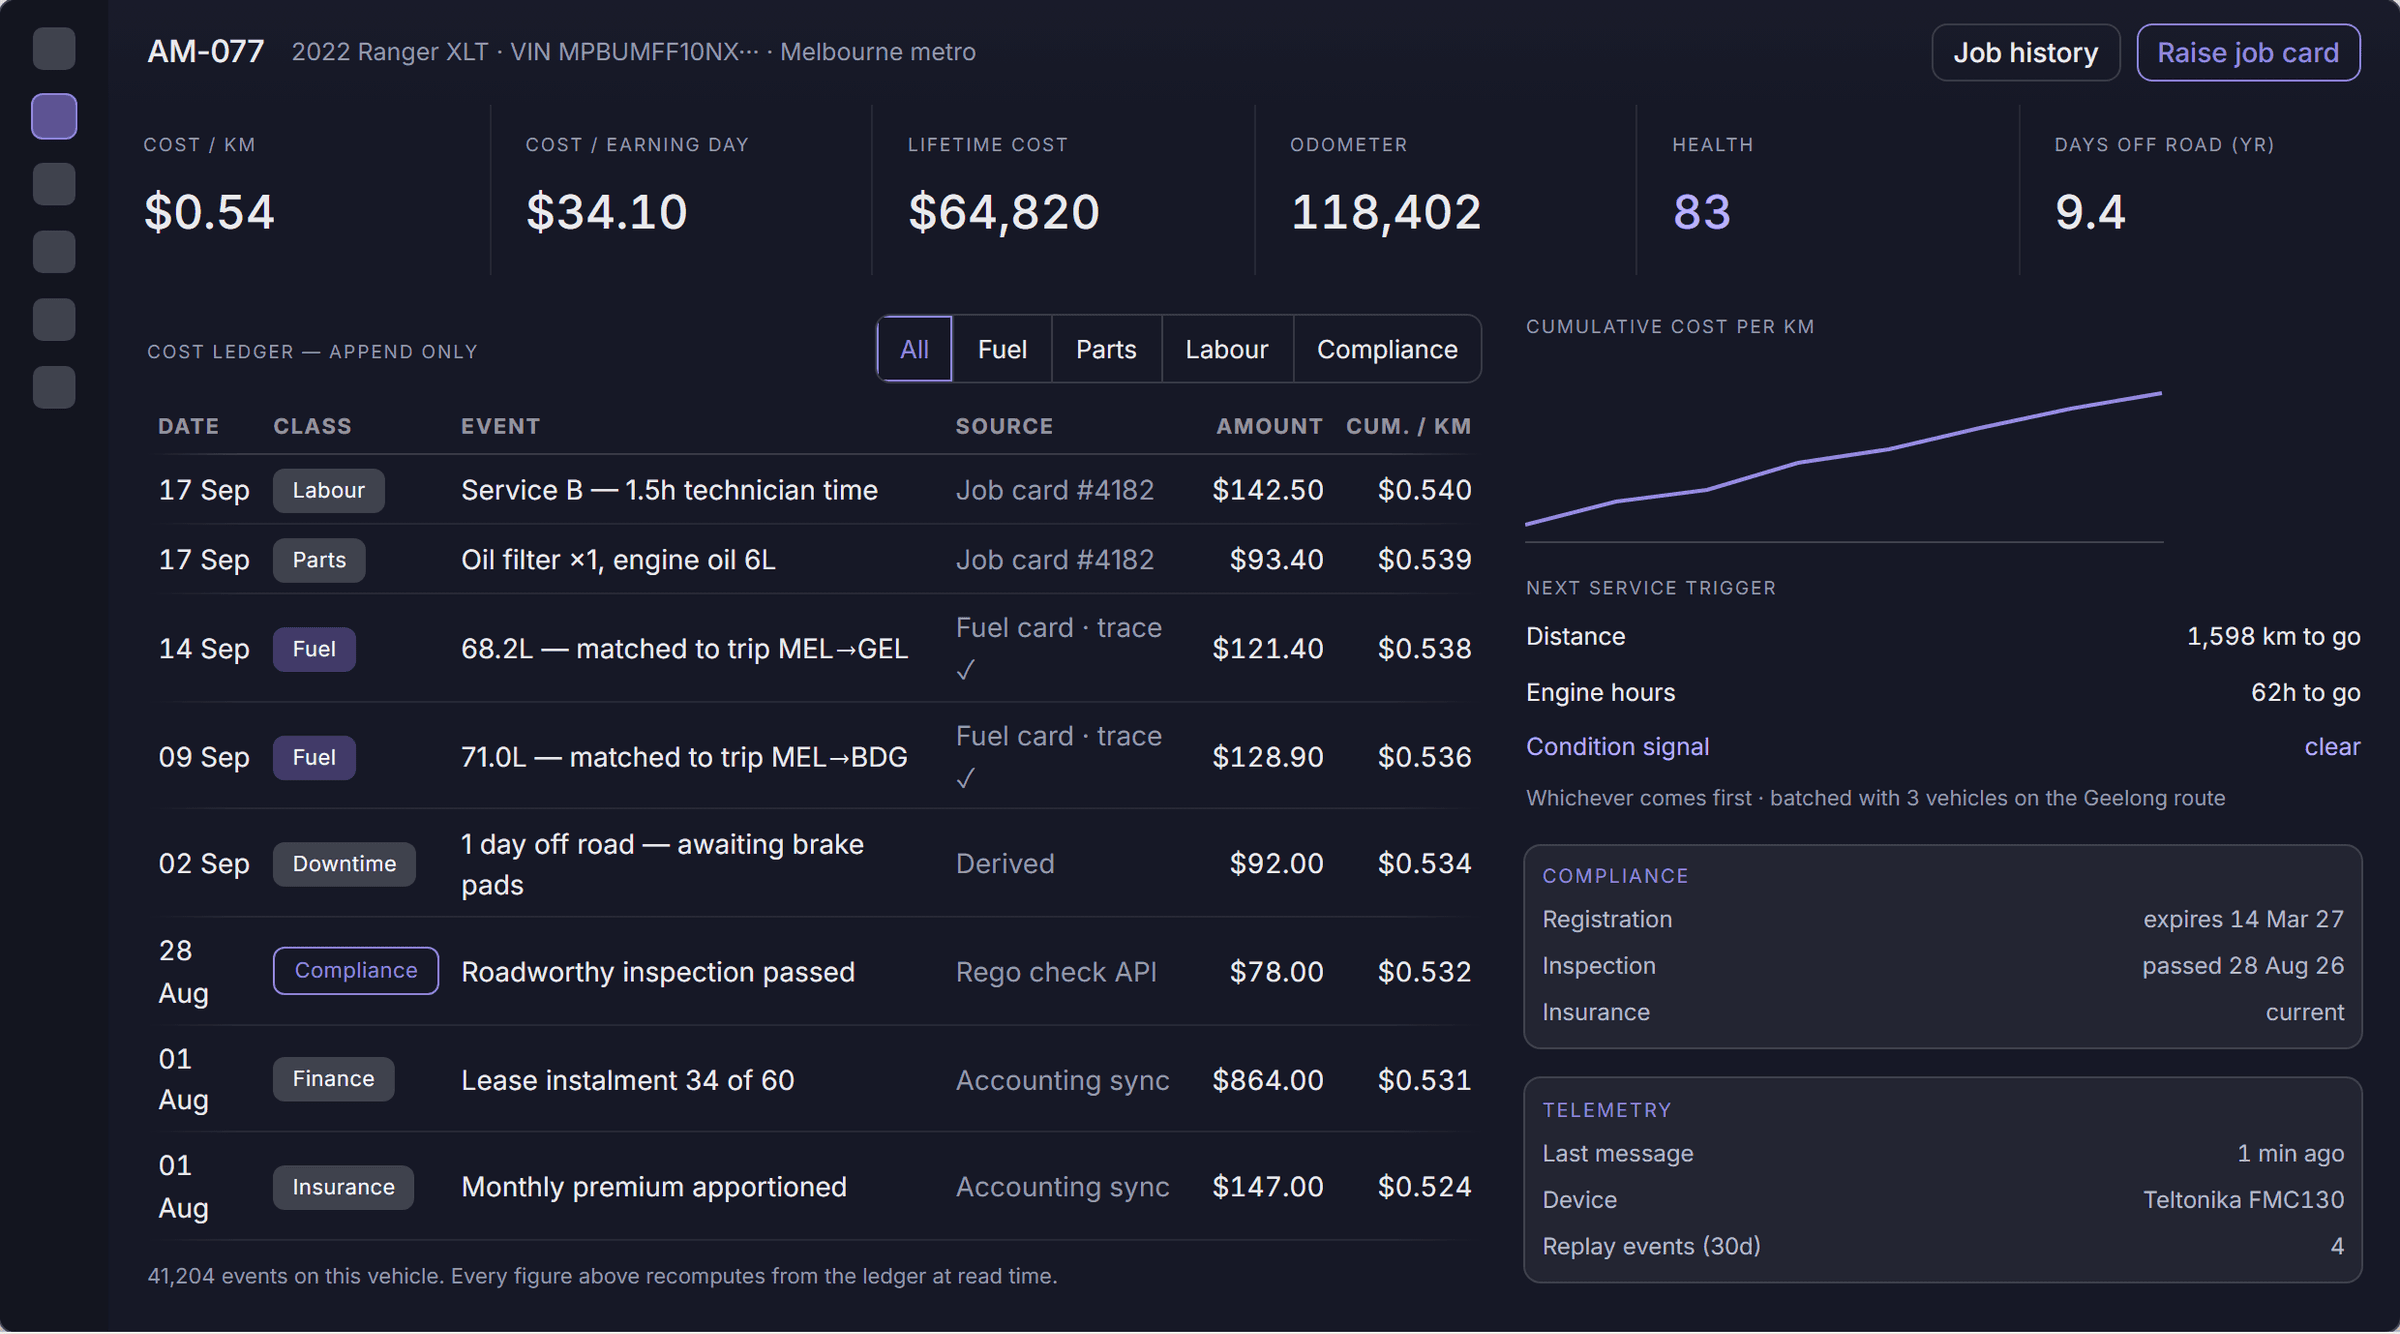
We started from the abstraction the business actually needed but didn't have: a true cost-per-vehicle number, derived rather than typed. Every cost event — acquisition, finance, insurance, fuel, parts, labour, compliance, downtime — was designed to append to a per-vehicle ledger, making cost per kilometre and cost per earning day auditable and correct at any point in time rather than a manually rebuilt spreadsheet figure. Telemetry was deliberately kept on a separate ingestion path from the operations console, so a flood of device traffic from 300 vehicles could never slow down the day-to-day tool fleet managers actually work in.
Solution
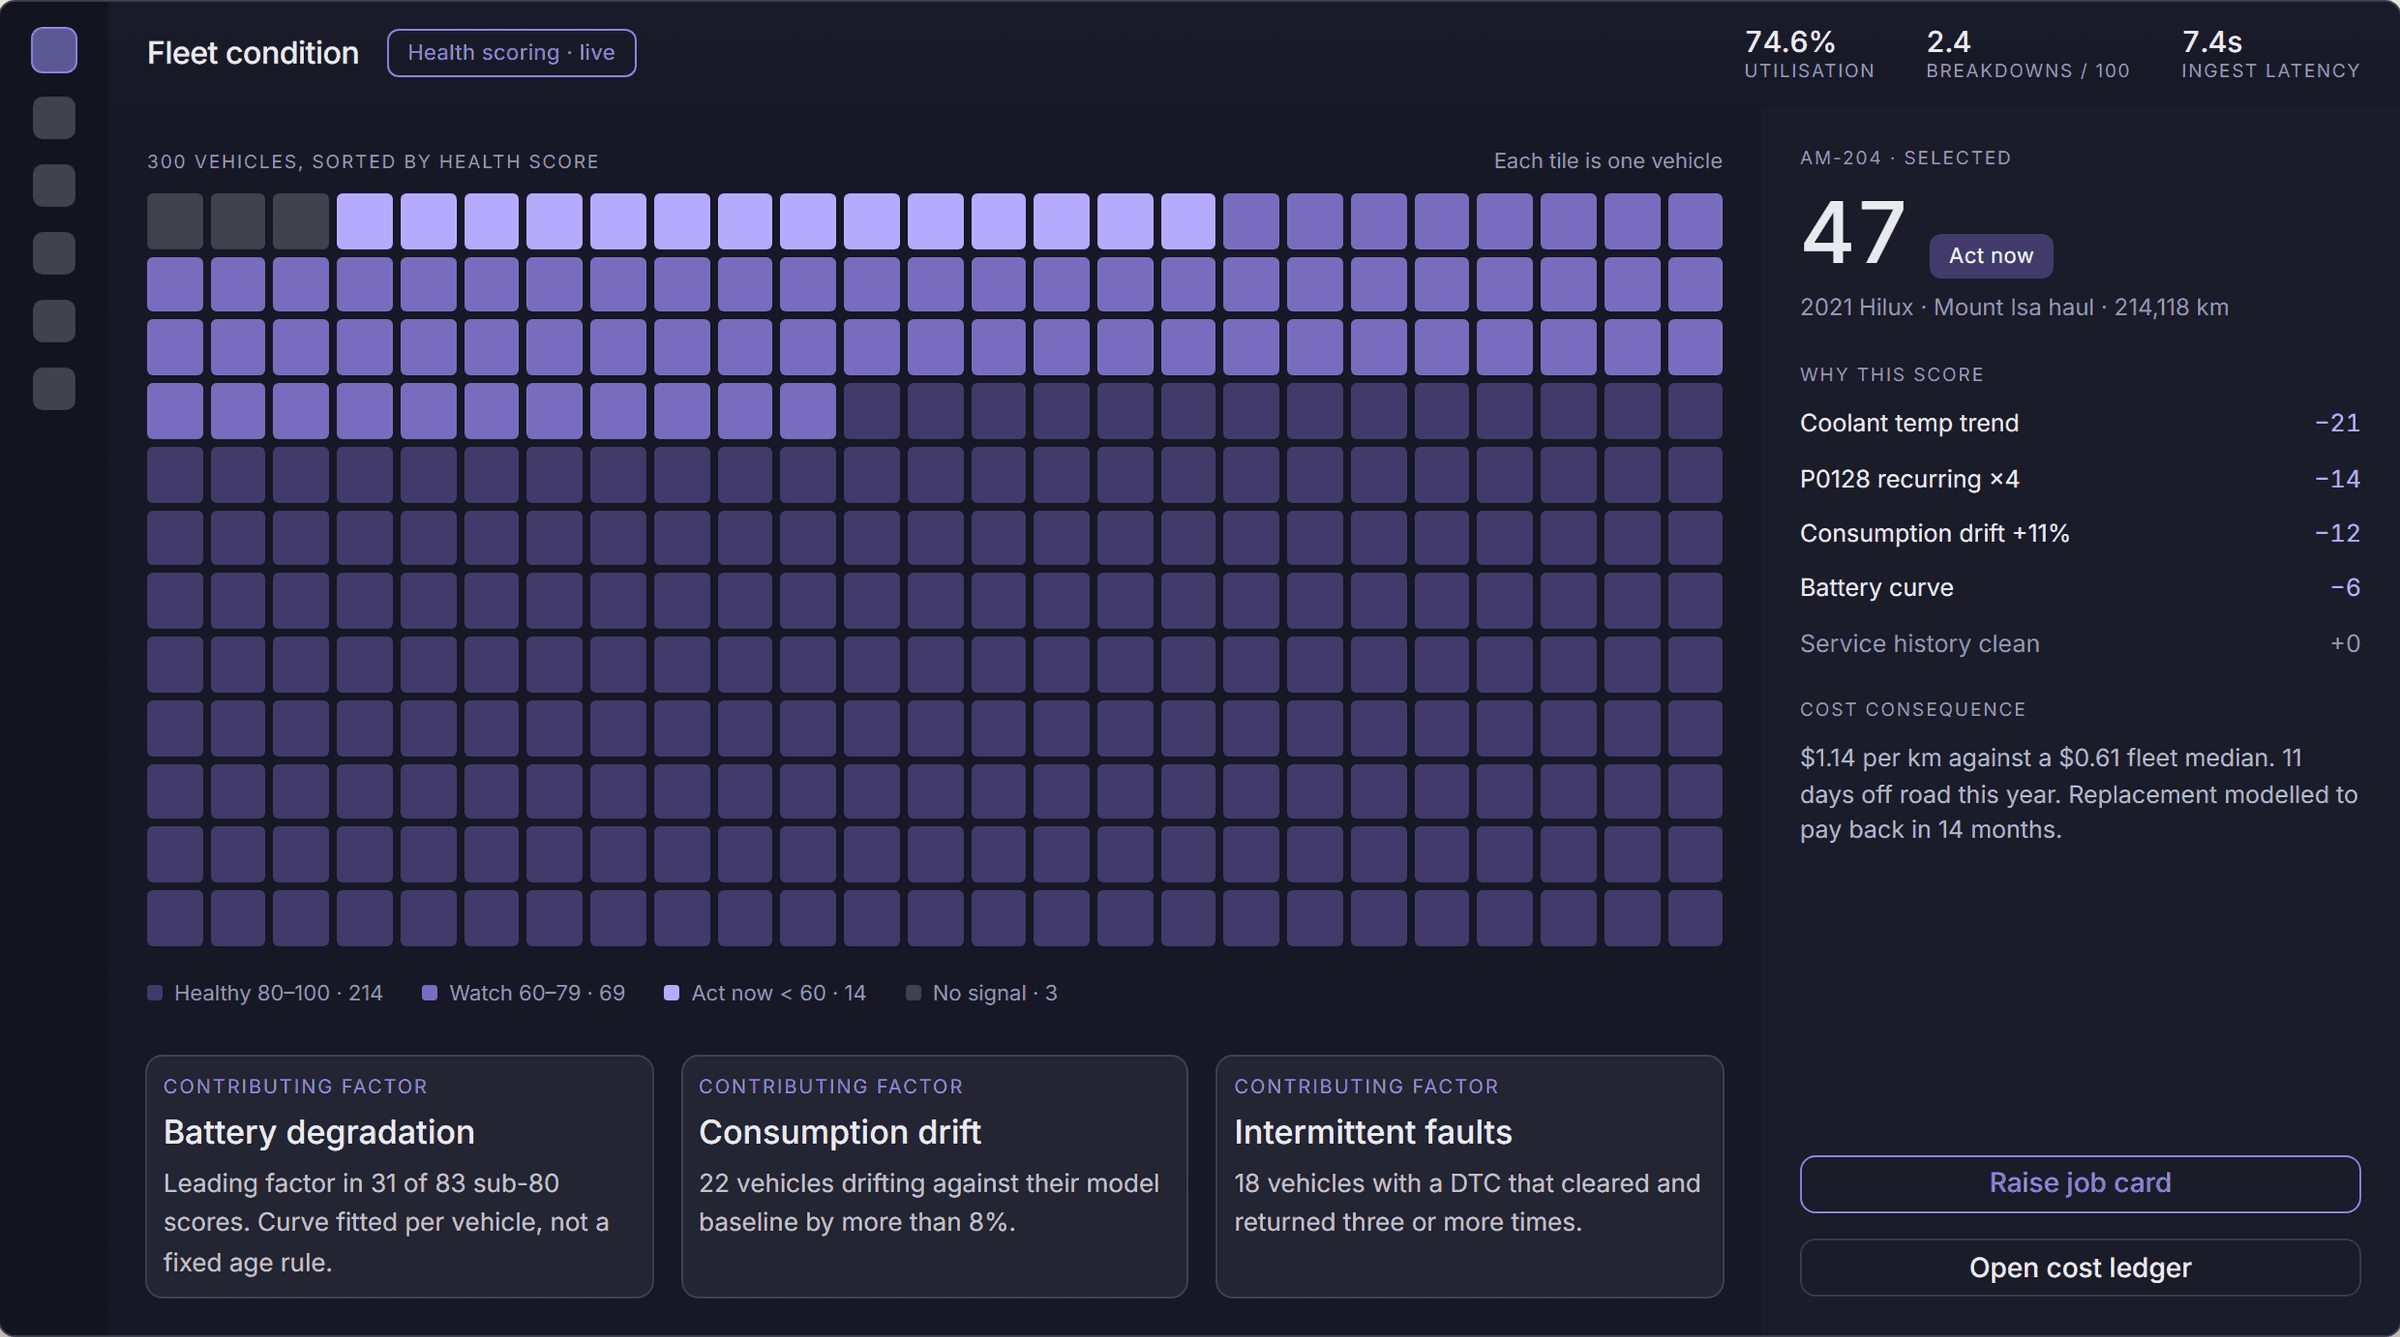
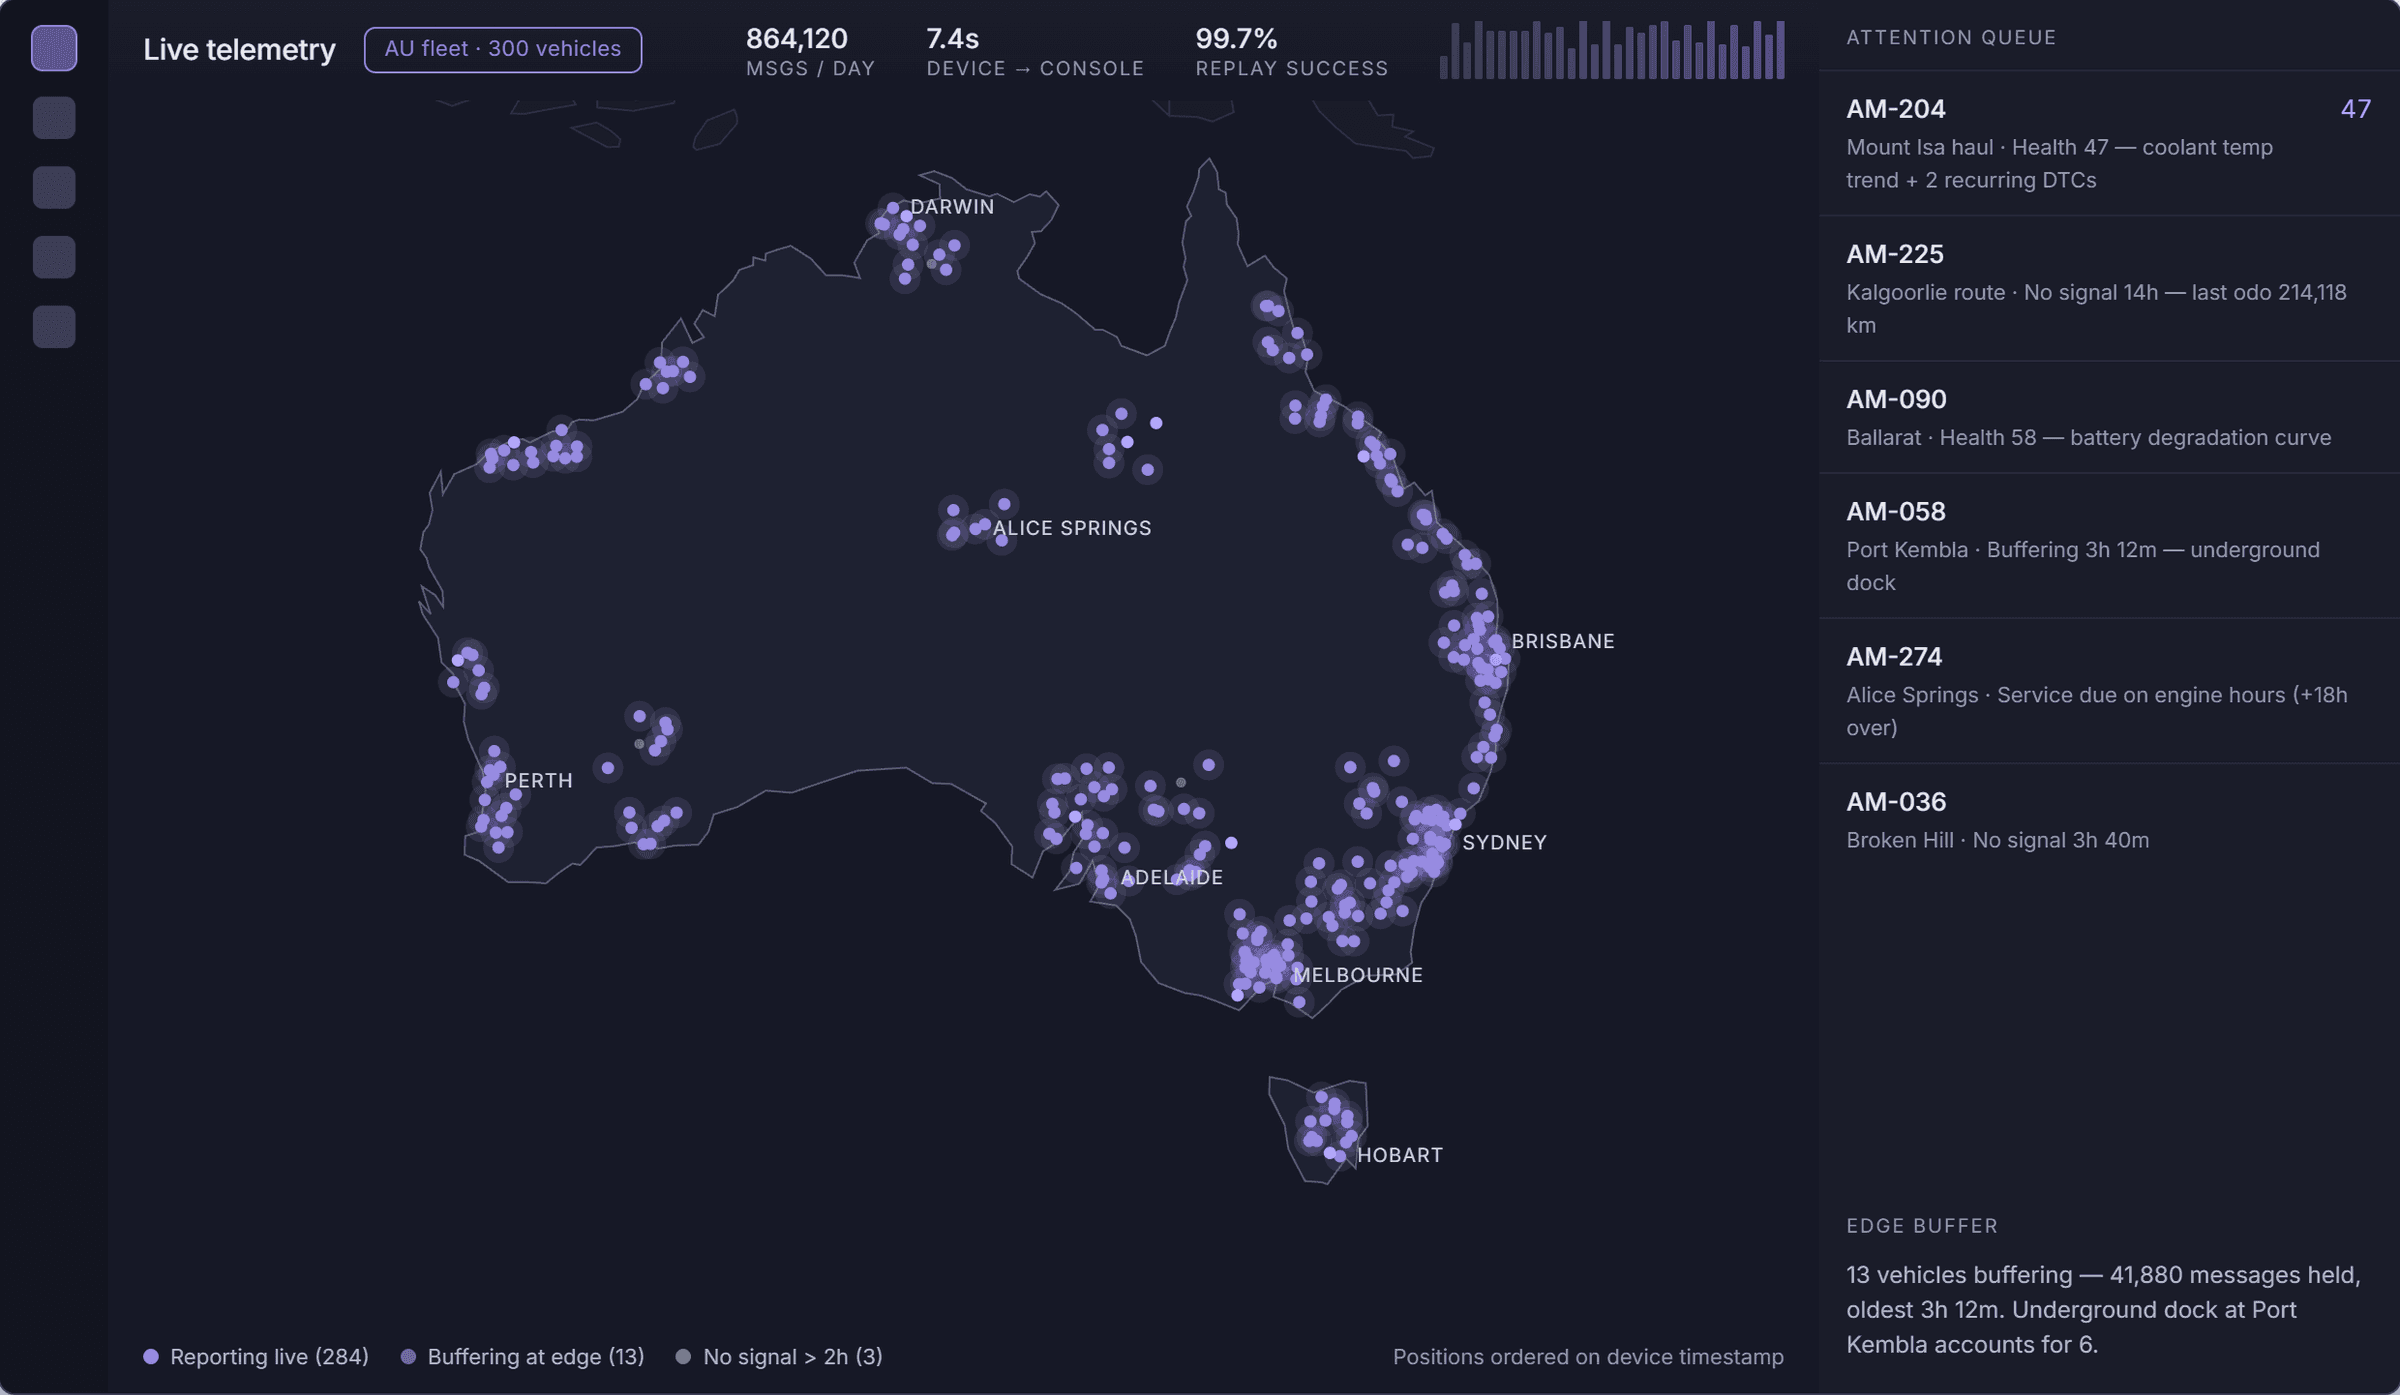
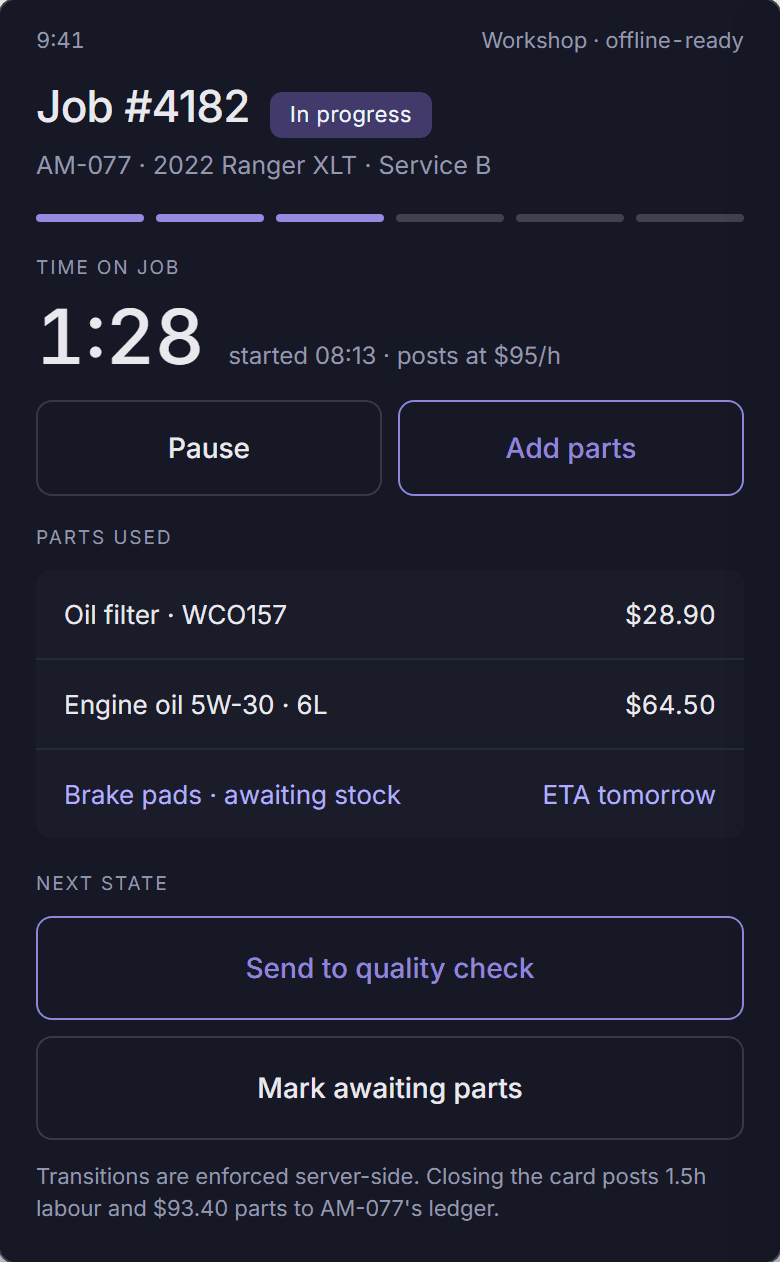
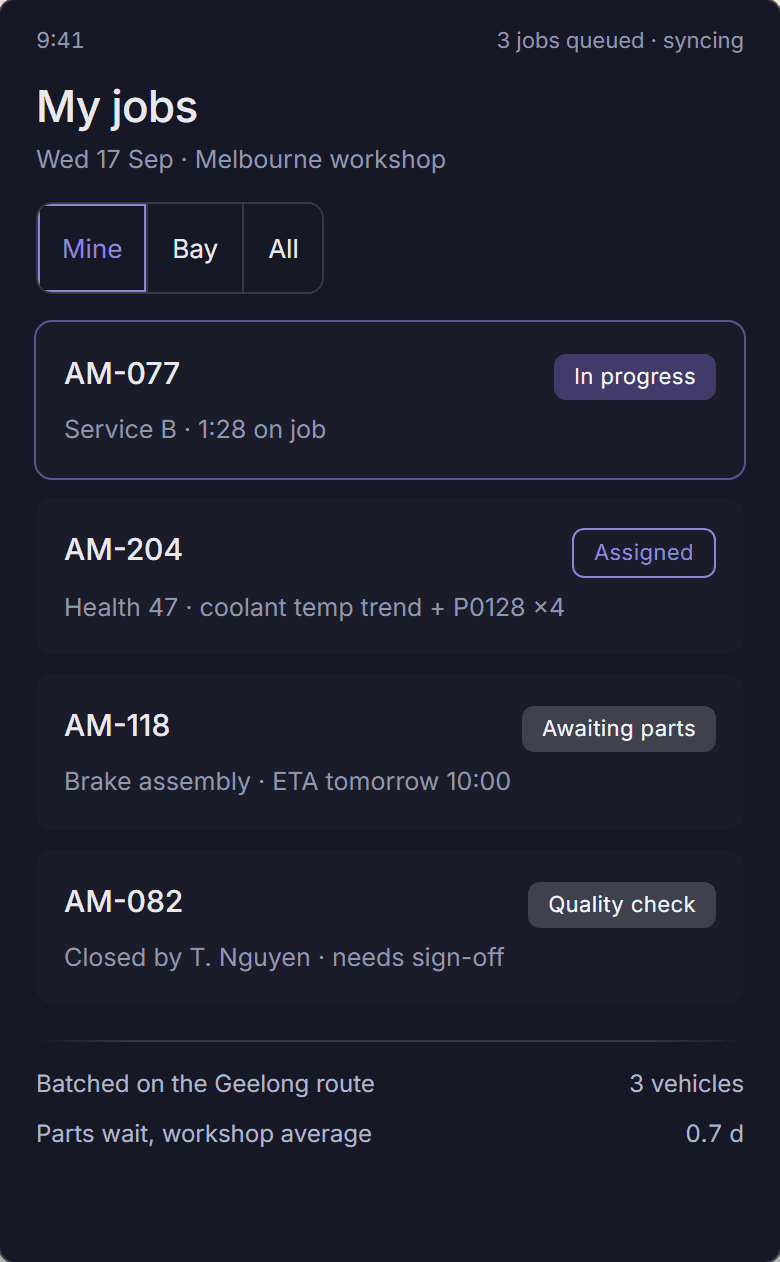
Roughly 864,000 telemetry messages a day flow through a lightweight broker into a stream processor that normalises, deduplicates, and enriches before writing to a time-series store with tiered retention — full resolution for live views, downsampled for trend analysis — reaching the console in under 8 seconds from the device. Vehicles operating in regional routes, underground loading docks, and workshop sheds lose coverage regularly, so the device buffers at the edge and replays on reconnect, ordering on device timestamp rather than receipt time; replay succeeds 99.7% of the time. Health scoring combines diagnostic trouble codes with trend detection — battery degradation curves, consumption drift against a model baseline, repeated intermittent faults — and returns a score with contributing factors listed rather than a bare number. Service scheduling triggers on distance, engine hours, or condition signal, whichever comes first, with jobs batched by route. Job cards run as an explicit state machine (raised, assigned, in progress, awaiting parts, quality check, closed) with transitions enforced server-side, and technician time and parts consumption post straight to the vehicle ledger. Fuel transactions are matched to a vehicle by card, then cross-validated against the telemetry trace — location, time, odometer — so a fill that doesn't correspond to a real trip is flagged rather than absorbed. An integration layer with per-provider adapters, retries, and a dead-letter queue connects fuel cards, telematics providers, accounting, VIN decode, and registration checks.
Results
Fleet utilisation
68.2%→74.6%
Unplanned downtime per vehicle
22.4→14.1 days/year
Unplanned breakdowns per 100 vehicles/month
4.1→2.4
Mean time to repair
4.6→2.8 days
Parts wait time
2.1→0.7 days
Maintenance cost per vehicle per year
AUD $3,240→AUD $2,760
Fuel spend unreconciled
6.8%→0.9%
Fleet admin headcount
2.5 FTE→1.2 FTE
Registration lapses
11/year→0
Annual value AUD $416,600 (conservative — excludes a further ~AUD $546,600 in utilisation gains attributed to demand and contract wins, not software) against an AUD $261,000 build (incl. telematics hardware) and AUD $92,400 annual running cost — 9.7-month payback
Product Screens
Ready to Build Something Great?
Book a free strategy session and get a tailored roadmap from our experts — no commitment required.